You've run your projection. Here's what it's telling you.
The dashboard is the payoff for everything you've entered. It won't tell you what to do — but it will show you, clearly, whether your plan holds together and where the pressure points are.
Three tabs, three lenses
There are three tabs across the top of the results screen: Dashboard, Monte Carlo, and Income & Account Detail. This guide covers the Dashboard tab. Monte Carlo has its own dedicated guide — it answers a different question.
Probability of success, simulation runs, what 82% actually means Monte Carlo guide → Dashboard says fully funded — but Monte Carlo shows lower confidence. Why? Dashboard vs. Monte Carlo →The verdict card
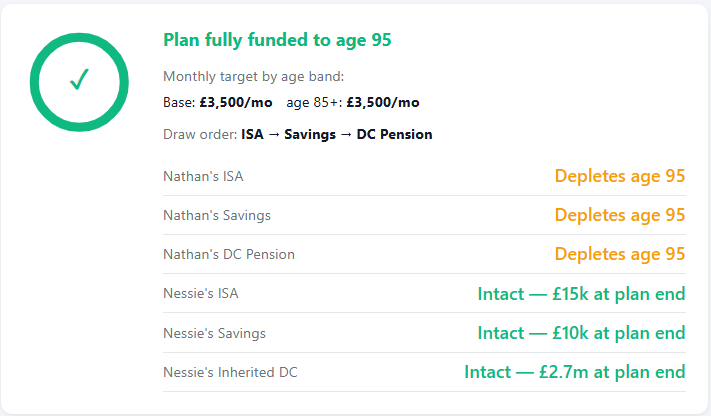
This is the first thing to look at. Either your plan is fully funded to your life expectancy or it isn't. A green tick means the projection holds. If it doesn't hold you'll see the age at which the plan runs into trouble — that's your starting point for adjusting assumptions.
Below the headline
- Monthly target by age band — if you've set spending bands these show here. In the example above, £4,300/mo as the base target dropping to £3,500/mo at age 85+.
- Draw order — the sequence the planner uses to fund your income from flexible accounts. ISA first, then Savings, then DC Pension in this example.
- Account depletion dates — each account listed with either the age it runs out or, if it survives to plan end, the balance remaining.
Green means intact. Amber means depleted — but note that depleted doesn't mean the plan has failed. It simply means that account ran its course and the next in the draw order took over.
In the example shown, Lee's accounts all deplete at age 95 — exactly at plan end, meaning they were used efficiently. Julie's accounts remain intact with significant balances, including an inherited DC pot at plan end. That's a meaningful legacy figure worth noting.
Annual cashflow — inflows vs spending target
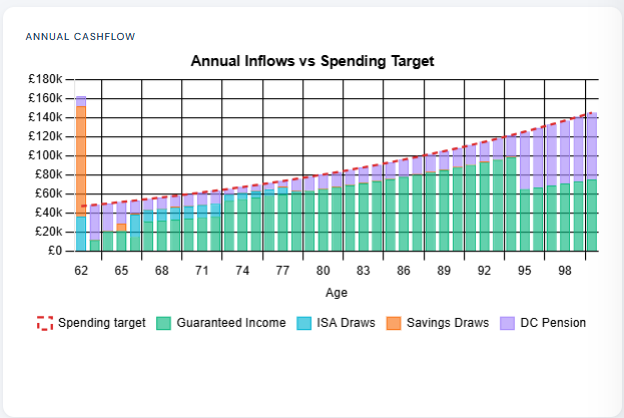
This chart shows, year by year, whether your income sources cover your spending target.
The dashed red line is your spending target — rising over time because it's inflation-adjusted. The stacked bars show where your income is coming from each year.
What to look for
- Do the bars consistently meet or exceed the dashed line? That's the question this chart answers.
- Early in retirement you may see larger draws from flexible accounts — particularly if you retire before state pension age. As guaranteed income kicks in at 67 the flexible draws typically reduce.
- Large isolated spikes are usually intentional one-off withdrawals — a lump sum planned at retirement, for example. Everything after should settle into a more regular pattern.
Wealth over time
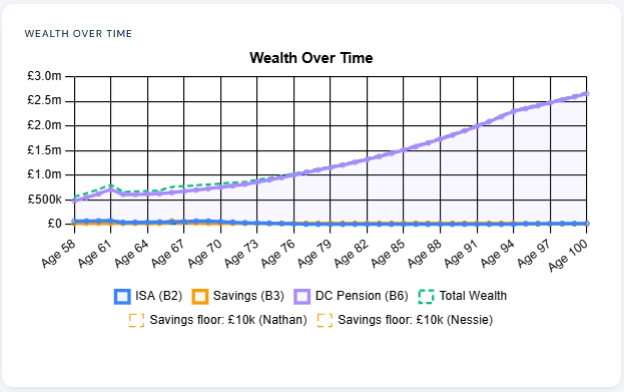
This chart shows the total value of your assets across the projection period, broken down by account type. Solid lines show each account balance year by year. The dashed line shows total wealth — the sum of all accounts combined.
What to look for
- Overall trajectory — is total wealth broadly stable, growing, or declining? A gentle decline is entirely normal in drawdown. A sharp early decline may indicate your draw rate is too aggressive.
- Account depletion points — you'll see individual account lines reach zero as they're exhausted in draw order. This is the visual representation of what the verdict card tells you in text.
- Floor lines — if you've set account floors these appear as dashed horizontal markers. The planner will not draw below these levels.
- Growth in later years — wealth rising in later life often reflects an inherited DC pot growing after one partner's accounts have been drawn down. The planner models the full couple picture, including inherited assets.
Income sources
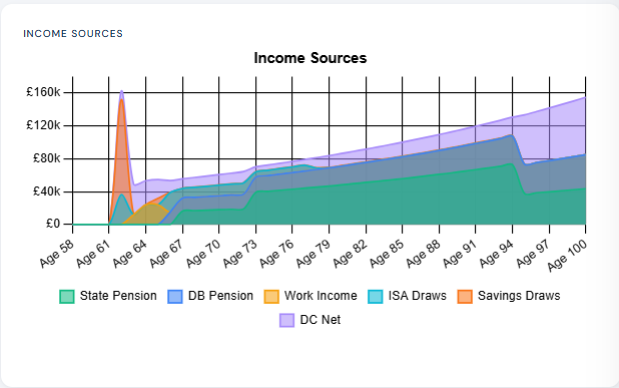
This stacked area chart shows the composition of your income at every age throughout retirement. It answers the question: where is my money actually coming from, year by year?
What to look for
In the early retirement years the income mix is typically heavier on flexible account draws — ISA, savings, DC. As guaranteed income layers in the flexible draws reduce proportionally. A well-structured plan shows guaranteed income progressively shouldering more of the load as you age, with flexible accounts gradually wound down in a controlled way.
A large spike in the early years is usually an intentional one-off withdrawal. Spikes like this are not errors — the planner is doing exactly what you told it to do.
What to do if the plan doesn't hold
If the verdict card shows the plan failing before life expectancy, don't panic — that's exactly what the planner is for. Go back and adjust:
-
1Retirement ageEven one or two years later can make a significant difference to both asset growth and the period over which they're drawn.
-
2Target incomeA modest reduction in spending has a compounding effect over decades. Small changes here can close a gap that looks significant.
-
3Growth assumptionsReview whether your assumed rates in Key Assumptions are realistic. Be consistent — optimistic rates in one account and conservative in another distorts the picture.
-
4Draw orderSometimes reordering which accounts are drawn first improves tax efficiency and longevity. ISA-first is usually the most tax-efficient default.
-
5Spending bandsModelling a spending reduction in later years often resolves a shortfall that appears at the margin. Set a lower target from age 80 or 85 and re-run.
Run the projection again after each change. The dashboard updates immediately, so you can see the impact of each adjustment in isolation. Save promising scenarios before moving on.