Your main projection tells you what happens if everything goes to plan. Monte Carlo tells you whether your plan can survive when it doesn't — particularly if your assets are invested in markets.
The standard projection runs your numbers using fixed growth rates. It's a straight line: same inputs, same answer every time. It answers "does my plan work if markets behave predictably?"
That's a useful starting point. But markets don't behave predictably.
They lurch, stall, recover, and occasionally collapse at exactly the wrong moment. A bad sequence of returns early in retirement — when your pot is at its largest and you're drawing from it — can permanently damage a plan that looked perfectly solid on paper. Monte Carlo stress-tests your plan against 1,000 different versions of the future and shows you how robust it really is.
What the simulation actually does
When you click Run Monte Carlo, the planner runs your complete projection 1,000 times. Each run uses a different set of randomly generated growth rates — one for each year of your retirement, independently drawn. Some years markets are strong. Some years they're weak. Each run is a different possible life.
The 1,000 results are then sorted and aggregated to show you the distribution — not a single answer but a range of outcomes from the unlucky end to the fortunate end, with everything in between.
This is the essential difference between the standard projection and Monte Carlo. The standard projection shows you the middle of the road. Monte Carlo shows you the whole road — including the ditches on either side.
How the randomness works — without the maths
Each year of each simulation, the planner draws a fresh random growth shock for your portfolio. That shock is centred on your configured growth rate — so on average across many years the return is what you expect — but it varies up and down around that average in a realistic way.
Crucially, each year's shock is independent. A bad year doesn't make the next year more likely to be bad, and a good year doesn't guarantee another one follows. This correctly models what's known as sequence-of-returns risk — the uncomfortable reality that the timing of bad years matters enormously, not just their average frequency.
A 20% loss in year one of retirement, when you're drawing income from a large pot, is far more damaging than the same loss in year fifteen when your pot is smaller. Monte Carlo captures this. Your standard projection does not.
How volatility is modelled
Volatility considerations are built into the simulation. The planner automatically applies different levels of year-to-year variation to each account type, calibrated to reflect how each behaves in practice:
- DC pension — the most variable (reflects equity market fluctuations)
- ISA — moderately variable (reflects a balanced fund)
- Savings accounts — very stable (reflects cash, minimal year-to-year movement)
Your guaranteed income sources — state pension, DB pension, rental income, annuities — do not vary at all in the simulation. They are fixed in every one of the 1,000 runs.
The confidence score and outcome breakdown
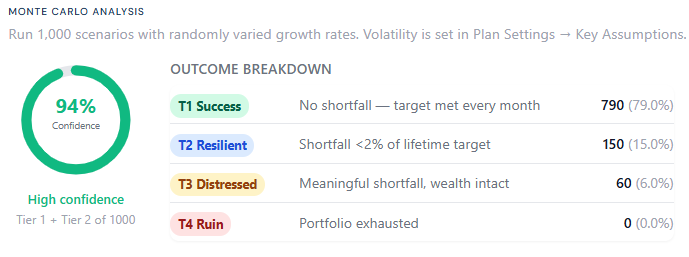
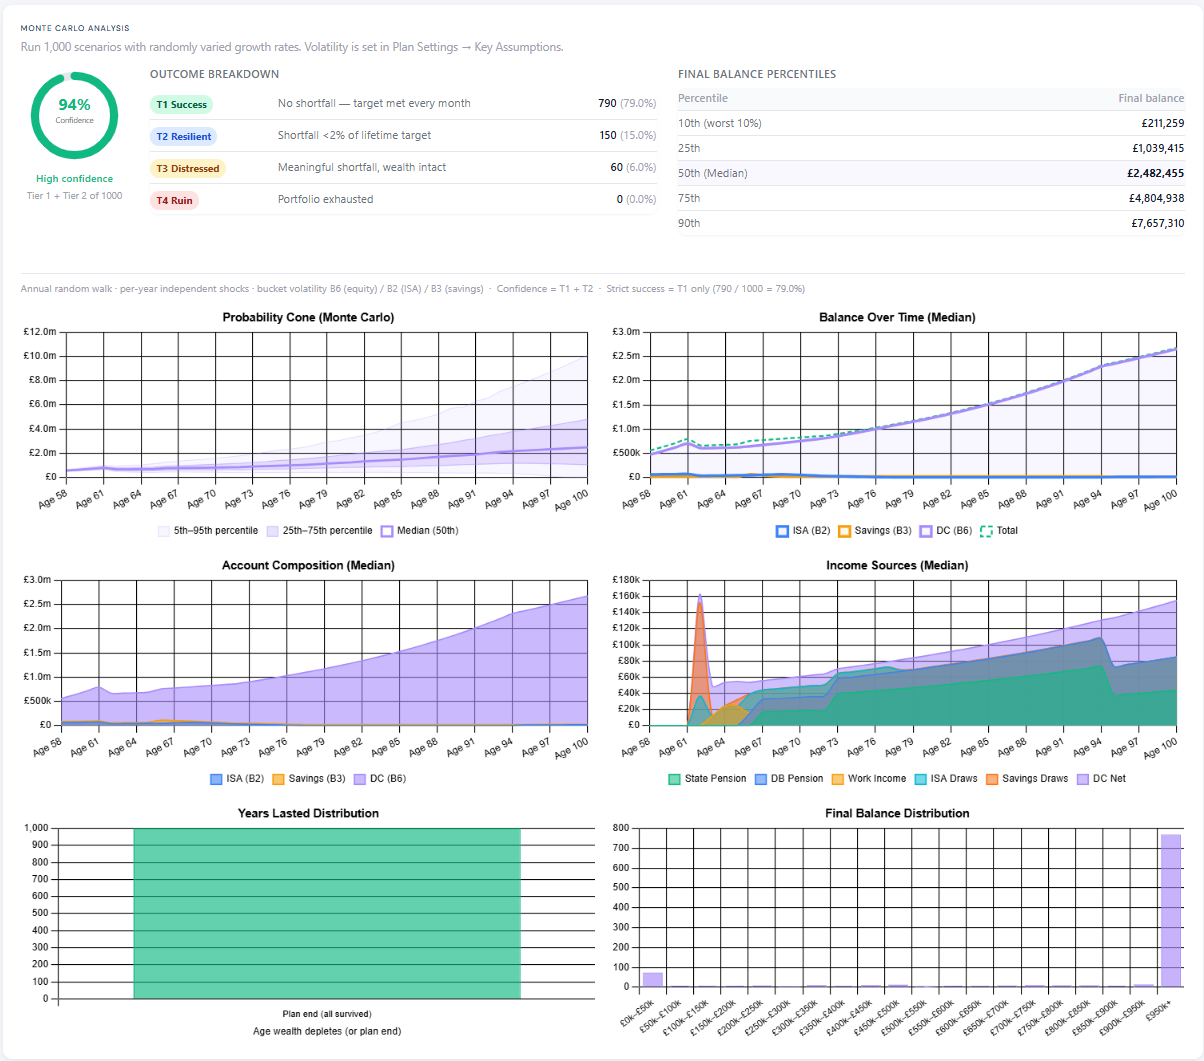
The dial is the headline number — the percentage of the 1,000 simulations where your plan broadly succeeded. The breakdown beneath gives the full picture across four tiers.
Target income met every single month, no shortfall at all. A high bar — even a single month where income fell fractionally short is not T1. Don't be alarmed if this number is low.
Shortfall of less than 2% of total lifetime income. In practice this means the plan delivered everything it promised with only trivial variance — a rounding error in the context of a 30-year retirement.
Meaningful shortfall, but wealth is not fully exhausted. The plan struggles in these scenarios but doesn't collapse. Assets remain — just not enough to cover every pound of the income target.
Portfolio fully exhausted. This is the number to watch most closely. Zero T4 across 1,000 simulations means not one scenario ended in running out of money entirely.
T1 + T2 combined is your real confidence number. If T1 is 0.7% and T2 is 70.7%, your confidence is 71% — meaning in 710 out of 1,000 simulated futures, the plan delivered its income target with no meaningful shortfall.
A T3 result doesn't always mean the plan is weak. It often means the plan hit a floor you deliberately set — a minimum savings balance you don't want the planner to draw below. The planner correctly respects that constraint and reports a shortfall rather than override it. Your money is still there. If your T3 rate is higher than you'd like, review your account floors before concluding there's a structural problem.
Final balance percentiles
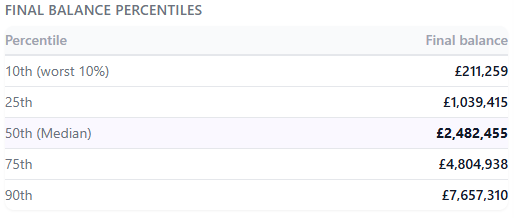
This table shows the range of portfolio values at plan end across all 1,000 simulations.
- 10th percentile — the outcome in the worst 10% of simulations. How bad does it get at the unlucky end?
- 50th percentile (median) — the middle outcome. Half of all simulations ended better than this, half worse. Your most useful planning reference point.
- 90th percentile — the outcome in the best 10% of simulations. The favourable tail.
The spread between the 10th and 90th percentile can be enormous — that's not a flaw, it's honesty. Over a 30–40 year retirement, compounding means small differences in annual returns produce radically different destinations. The median is what to plan around. The 10th percentile is what to make sure you can survive.
The probability cone
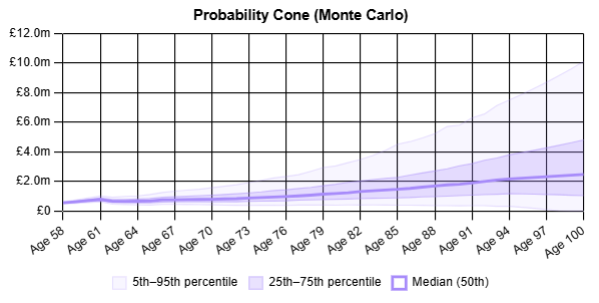
This is the visual representation of all 1,000 simulations running simultaneously, showing total portfolio value from today to plan end.
- The central line is the median — the middle outcome across all runs
- The inner band covers the middle 50% of outcomes (25th to 75th percentile)
- The outer band covers the middle 90% of outcomes (5th to 95th percentile)
The cone widens as you move further into the future — uncertainty compounds over time. That's correct and expected.
What to look for
- Does the lower edge stay above zero throughout? If so, even your worst realistic outcomes survive to plan end. If the lower edge reaches zero early in retirement, a meaningful portion of simulations end in ruin — and that warrants revisiting your assumptions.
- How wide is the cone? A very wide cone reflects high volatility assumptions or a long time horizon. A narrow cone in the early years widening progressively is the normal healthy shape.
The remaining charts
Balance over time (median)
Shows how each account type — ISA, savings, DC pension — evolves under the median simulation. Compare this to your standard dashboard. If they're broadly similar, your fixed growth assumptions are a reasonable representation of the typical real-world outcome.
Account composition (median)
Shows the proportion of wealth in each account type over time. Useful for seeing whether your draw order is preserving your tax-efficient accounts or depleting them earlier than intended.
Income sources (median)
Mirrors the income chart on the standard dashboard but under median simulation conditions. The shape should be familiar — guaranteed income building over time, flexible draws reducing as state pension and DB income layer in.
Years lasted distribution
Each bar is the number of simulations where wealth lasted to a given age. All bars reaching plan end means every simulation survived. Bars dropping off before plan end indicate how many simulations, and at what age, the plan ran into serious trouble.
Final balance distribution
A histogram of the 1,000 final portfolio values. A large cluster at the high end reflects simulations where long-term growth produced very strong outcomes in favourable market conditions. The shape of this distribution tells you whether your outcomes are broadly predictable or widely variable.
What Monte Carlo doesn't tell you — and why that's fine
The simulation makes several deliberate simplifications that are worth understanding.
- Returns are independent year to year Real market crashes tend to persist — a bad year is somewhat more likely to be followed by another bad year. The model doesn't capture this, which means it may slightly understate the risk of a prolonged downturn.
- Asset classes move independently In a real crash, equities, bonds, and property often fall together. The model treats DC pension, ISA, and savings as having unrelated annual shocks. For diversified portfolios this is a reasonable approximation; for equity-concentrated plans it may understate correlated crash risk.
- Returns follow a normal distribution Real markets have fat tails — extreme events happen more often than a normal distribution predicts. Raising your volatility setting is the practical way to stress-test for this.
- Spending is fixed Real retirees reduce spending in bad markets. The model doesn't do this automatically — though the dynamic spending feature in Plan Settings lets you model it manually.
None of these limitations make Monte Carlo unreliable for its purpose. They make it a tool to use alongside judgement, not instead of it.
How to use it practically
Run your standard projection first and make sure the plan holds deterministically. Then run Monte Carlo and focus on three questions.
-
1Is T4 Ruin at or near zero?Above 5% your plan has a genuine structural problem worth addressing — not tweaking.
-
2Is T1+T2 confidence above 70%?Below that, consider whether your growth assumptions are realistic or your income target needs adjusting.
-
3Does the lower edge of the cone stay above zero?If not, some of your simulated futures end in portfolio exhaustion — worth taking seriously.
If the results concern you, go back and adjust. Retirement age, income target, volatility assumption. Run it again. Use Monte Carlo iteratively as a stress-testing tool, not a one-time verdict.
A high confidence score is genuinely reassuring. It is not a guarantee — no model can provide one. What it gives you is an honest, quantified sense of how much margin your plan carries against an uncertain future.